Monitoring the Pogoplug E02 with monit
Why monitoring ?
You’d ideally never want to waste time to manually check up on services on your machines. That’s why it’s best to set up a monitoring system so it can alert you if something isn’t just right or even better, it can actually act on simple errors in the moment they occur.
Popular solutions
Since this is such a crucial part of system administration, there are many solutions out there already. They differ in price, resource allocation needed, platform etc. Most popular ones include Nagios1, PRTG2, Zabbix3, Munin4, Icinga5. There are also solutions who aren’t self hosted, but reside in the cloud, like New Relic6, DataDog7.
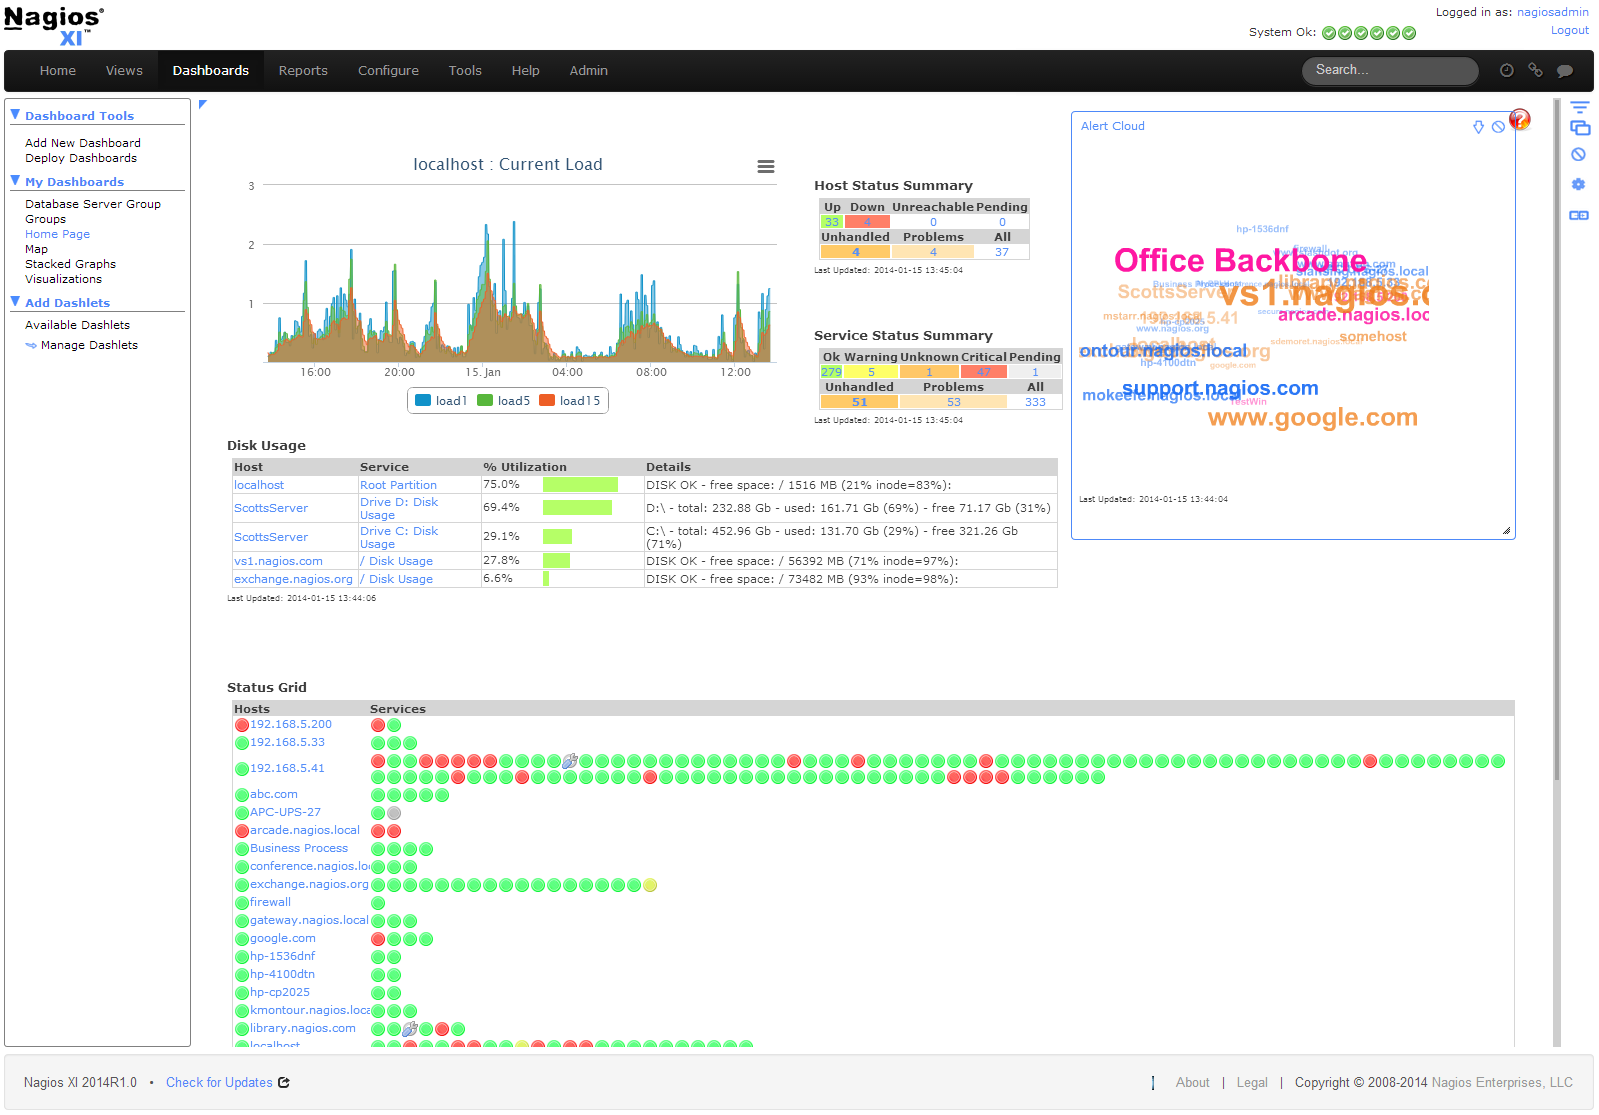
Most popular solution Nagios and its dashboard. (Photo Credit: nagios.com).
To decide for which solution to aim for we have three parameters in mind:
- resource usage
- platform compatibility
- price.
For a small server with 256MB RAM like Pogoplug E02 the self hosted options are just too heavy on resources to gain significant value from them. A viable option would be running the one in the cloud, but since the Pogo is on an ARM architecture, support for it is very rare. Cloud solutions also usually cost money, which is completely fine, but for a small server like Pogo, something else and free might come more in handy.
I’ve recently stumbled upon it, it’s called monit8. Monit runs an embedded lightweight HTTP server and serves the dashboard itself, that’s why it’s so light on resources, since it doesn’t require a separate HTTP server or a database. It has packages for most popular *nix distributions.
monit
monit8 is actually a free version of a commercial package called m/monit9, who offers much more for an one-time fee. But even monit as a free solution is quite powerful. It can monitor files, directories, disks, processes, system and hosts. Alerting via e-mail is also configurable, and to expand the alerting it can also run actions, like for example restarting a process if it consumes too much resources in a given time period (which is one of the things you do usually if you notice it).
Installation
Since the package is available in the Arch Linux repository, the installation is pretty simple.
$ sudo pacman -S monitThe service runs as root and can be started with the systemctl command.
$ sudo systemctl start monitConfiguration
The configuration for it is saved in /etc/monitrc and is owned by root user. The documentation for configuring the monitoring tool is extensive and can be read here.
We’re going to configure monitoring of services we previously installed on the Pogoplug E02 and display them on a simple dashboard overview, the network interface and storage drives. Alerting via e-mail won’t be enabled for this home use-case. Using a favorite text editor, we’ll add couple lines to /etc/monitrc.
At first we set the monitoring interval to 60 seconds.
set daemon 60 # check services at 60 seconds intervalsIf you want to access the monitoring dashboard from other devices you’ll need to comment the use address localhost and allow localhost lines, which are there by default. You can also set an admin user and a read-only user here. Read-only user can only view the dashboard, but can’t start/monitoring from it. Make sure the passwords aren’t that easy to guess for the admin user, you could also use PAM for authentication, which is described in the documentation.
set httpd port 2812 and
#    use address localhost  # only accept connection from localhost
#    allow localhost        # allow localhost to connect to the server and
#    allow admin:monit      # require user 'admin' with password 'monit'
     allow tadej:somepass
     allow user:guest read-only
Services which don’t have a .pid file on the filesystem are configured by matching keyword which searches for the described process name. Here we configured just an overview for installed services.
check process monit with pidfile /var/run/monit.pid
check process sshd with pidfile /var/run/sshd.pid
check process serviio
  matching "serviio"
check process transmission
  matching "transmission"
check process smbd with pidfile /var/run/smbd.pid
check process nmbd with pidfile /var/run/nmbd.pid
check process ntpd
  matching "ntpd"
check process dnsmasq
  matching "dnsmasq"
Setting up monitoring for the filesystem is also simple, here we’ve set it for the root USB flash drive and external HDD.
check filesystem root with path /dev/root
check filesystem hdd1 with path /dev/sdb1
At the end of the configuration file, we configure the overview of the network interface.
check network eth0 with interface eth0After we’ve entered our configuration, monit has a parameter which checks if the syntax is OK.
$ sudo monit -t
Control file syntax OK
Now we run the monit service, set it to be run at boot and check if it’s ok.
$ sudo systemctl start monit
$ sudo systemctl enable monit
$ sudo systemctl status monit

* monit.service - Pro-active monitoring utility for unix systems
   Loaded: loaded (/usr/lib/systemd/system/monit.service; enabled; vendor preset: disabled)
   Active: active (running) since Wed 2015-05-27 11:41:49 CEST; 4s ago
  Process: 32011 ExecStop=/usr/bin/monit -c /etc/monitrc quit (code=exited, status=0/SUCCESS)
 Main PID: 32014 (monit)
   CGroup: /system.slice/monit.service
           `-32014 /usr/bin/monit -I -c /etc/monitrc

May 27 11:41:49 pogo systemd[1]: Started Pro-active monitoring utility for unix systems.
May 27 11:41:49 pogo monit[32014]: Starting Monit 5.13 daemon with http interface at [*]:2812
May 27 11:41:49 pogo monit[32014]: Starting Monit 5.13 daemon with http interface at [*]:2812
May 27 11:41:49 pogo monit[32014]: Starting Monit HTTP server at [*]:2812
May 27 11:41:49 pogo monit[32014]: Monit HTTP server started
May 27 11:41:49 pogo monit[32014]: 'pogo.lan.tdkl.eu' Monit started
Now we can navigate to the monit interface with the browser to see the overview.
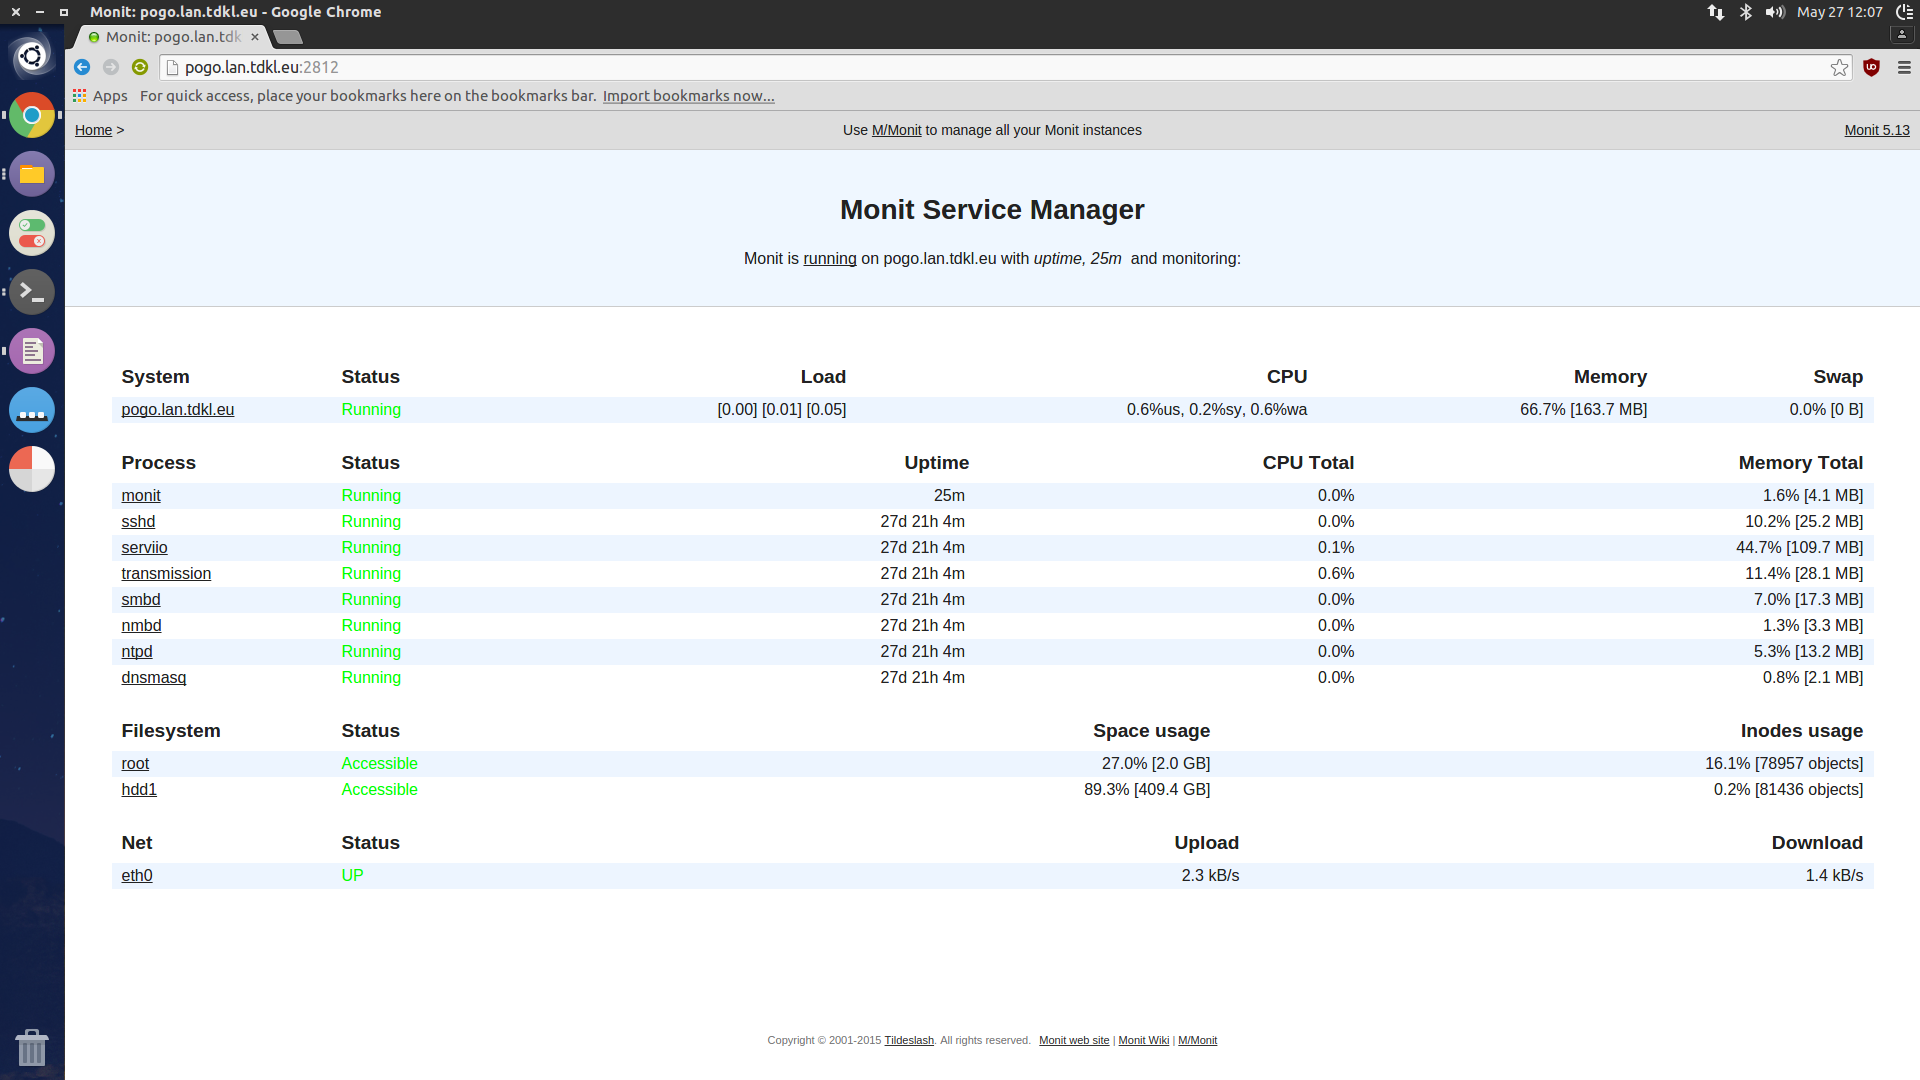
Screenshot of the dashboard in the browser which displays configured services, storage and network interface.
Conclusion
Monit is an easy to setup service that’s light on resources and free. Considering we don’t run a HTTP or SQL server that hosts anything, there isn’t much sense into configuring alerting or service actions on certain alerts like on larger systems. The question is if we would even decide to use monit there. These kind of decisions are always based on the context and needs. But for the Pogoplug E02, monit is a great solution.
- https://www.nagios.com/ [return]
- https://www.paessler.com/prtg [return]
- http://www.zabbix.com/ [return]
- http://munin-monitoring.org/ [return]
- https://www.icinga.org/ [return]
- http://newrelic.com/ [return]
- https://www.datadoghq.com/ [return]
- https://mmonit.com/monit/ [return]
- https://mmonit.com/ [return]